5 minutes into the first work day of 2020 and boom!
Tag: computers are evil
Must be my accent
Every time – every single time – that I spell my email to someone over the phone in french, they add an ‘A’ at the start of it. Conversation invariably goes like this:
me: mon addresse email est R-G-L-C….
other person: ok, A-R-G-L-C….
me: non, non, il n’y a pas de A
So I got fed up and registered the email address with the typo in it, and now it will automatically forward the wrong email to my correct one, and send an auto-response message:
Every damn time GLOBE pushes an update…
This word!
It always works on the dev’s machine
Sphincter-clenching moment
I’ve been on a course for the last week. Hours are brutal, 8:30am to 7pm. Been taking lots of notes on disk, in jupiter notebook files. This is something that I don’t want to lose. The course has a git repo, which I’ve forked on github. This is what happened today:
– pull class repo to get latest files.
– try to push to my github repo. Sadly, this fails, as one of the data files is 102MB and is bigger than github’s file size limit.
– try and git rm the file from my source tree
– try to push to github, that’s a fail.
– look on StackOverflow for magic git incantation to remove file from git history. This is not something that you normally want to do.
– run magic incantation
– REVERT FUCKING GIT HISTORY TO A POINT WHERE THE COURSE STARTED, THUS LOSING 4 DAYS OF WORK AND NOTES!!!!!

– Quickly run through 5 stages of grief.

– Realize that Jupiter notebook is smart/stupid at the same time, and that the versions I have in memory are different than the ones on disk.
– Preciously save MULTIPLE COPIES/EXPORTS of all the important files.

– Unclench
The biggest lie on the internet is…
… ‘I have read and agree to the terms and conditions’.
Each and every internet user, were they to read every privacy policy on every website they visit would spend 25 days out of the year just reading privacy policies. If it was your job to read privacy policies for 8 hours per day, it would take you 76 work days to complete the task. For a given EULA, 73% of people admit to not reading all the fine print. Of those who do, only 17% say they understand it.
Dealing with Facebook fuckwittery
Before going on holiday, I got this by email from WordPress :
“Starting August 1, 2018, third-party tools can no longer share posts automatically to Facebook Profiles. This includes Publicize, the Jetpack tool that connects your site to major social media platforms (like Twitter, LinkedIn, and Facebook). Will this affect your ability to share content on Facebook? It depends. If you’ve connected a Facebook Profile to your site, then yes: Publicize will no longer be able to share your posts to Facebook.”
So, in order for my blog posts to automagically be posted to FB, I’ve created a page: The Beaver Is A Proud And Noble Animal. This is where my posts should appear from now on.
The struggle is real
You are not the user
Across 33 rich countries, only 5% of the population has high computer-related abilities, and only a third of people can complete medium-complexity tasks.
One of usability’s most hard-earned lessons is that you are not the user. This is why it’s a disaster to guess at the users’ needs. Since designers are so different from the majority of the target audience, it’s not just irrelevant what you like or what you think is easy to use — it’s often misleading to rely on such personal preferences.
For sure, anybody who works on a design project will have a more accurate and detailed mental model of the user interface than an outsider. If you target a broad consumer audience, you will also have a higher IQ than your average user, higher literacy levels, and, most likely, you’ll be younger and experience less age-driven degradation of your abilities than many of your users.
There is one more difference between you and the average user that’s even more damaging to your ability to predict what will be a good user interface: skills in using computers, the Internet, and technology in general. Anybody who’s on a web-design team or other user experience project is a veritable supergeek compared with the average population. This not just true for the developers. Even the less-technical team members are only “less-technical” in comparison with the engineers. They still have much stronger technical skills than most normal people.
OECD Skills Research
A recent international research study allows us to quantify the difference between the broad population and the tech elite. The data was collected from 2011–2015 in 33 countries and was published in 2016 by the OECD (the Organisation for Economic Co-operation and Development, a club of industrialized countries). In total, 215,942 people were tested, with at least 5,000 participants in most countries. The large scale of this study explains why it took a few years to publish the findings.
The research aimed to test the skills of people aged 16–65, which is the age range referred to as “adults” in the report. While it’s true that people aged 66+ are rare in the workforce (and thus of less interest to this workforce-targeted project), they are a major user group for many websites. Our research with users older than 65 has found many important usability issues for this age segment, who often has lower technology skills than younger users. Thus, in assessing the OECD findings, we should remember that the full user pool has lower skills than what the study data shows.
The OECD project looked at a broad range of job-related skills, but of most interest to us is the test of technology skills. For this part of the study, participants were asked to perform 14 computer-based tasks. Instead of using live websites, the participants attempted the tasks on simulated software on the test facilitator’s computer. This allowed the researchers to make sure that all participants were confronted with the same level of difficulty across the years and enabled controlled translations of the user interfaces into each country’s local language.
The tasks ranged in difficulty from very straightforward to somewhat complicated. One of the easy tasks was to use the reply-all feature for an email program to send a response to three people. This was easy because the problem was explicit and involved a single step and a single constraint (the three people).
One of the difficult tasks was to schedule a meeting room in a scheduling application, using information contained in several email messages. This was difficult because the problem statement was implicit and involved multiple steps and multiple constraints. It would have been much easier to solve the explicitly stated problem of booking room A for Wednesday at 3pm, but having to determine the ultimate need based on piecing together many pieces of info from across separate applications made this a difficult job for many users.
Even the supposedly difficult tasks don’t sound that hard and I certainly expect all of my readers to be able to perform them speedily and with a high degree of confidence. However, my entire point is that just because you can do it, it doesn’t mean that the average user can do so as well.
The 4 Levels of Technology Proficiency
The researchers defined 4 levels of proficiency, based on the types of tasks users can complete successfully. For each level, here’s the percentage of the population (averaged across the OECD countries) who performed at that level, as well as the report’s definition of the ability of people within that level.
“Below Level 1” = 14% of Adult Population
Being too polite to use a term like “level zero,” the OECD researchers refer to the lowest skill level as “below level 1.” This is what people below level 1 can do: “Tasks are based on well-defined problems involving the use of only one function within a generic interface to meet one explicit criterion without any categorical or inferential reasoning, or transforming of information. Few steps are required and no sub-goal has to be generated.”
An example of task at this level is “Delete this email message” in an email app.
Level 1 = 29% of Adult Population
This is what level-1 people can do: “Tasks typically require the use of widely available and familiar technology applications, such as email software or a web browser. There is little or no navigation required to access the information or commands required to solve the problem. The problem may be solved regardless of the respondent’s awareness and use of specific tools and functions (e.g. a sort function). The tasks involve few steps and a minimal number of operators. At the cognitive level, the respondent can readily infer the goal from the task statement; problem resolution requires the respondent to apply explicit criteria; and there are few monitoring demands (e.g. the respondent does not have to check whether he or she has used the appropriate procedure or made progress towards the solution). Identifying content and operators can be done through simple match. Only simple forms of reasoning, such as assigning items to categories, are required; there is no need to contrast or integrate information.”
The reply-to-all task described above requires level-1 skills. Another example of level-1 task is “Find all emails from John Smith.”
Level 2 = 26% of Adult Population
This is what level-2 people can do: “At this level, tasks typically require the use of both generic and more specific technology applications. For instance, the respondent may have to make use of a novel online form. Some navigation across pages and applications is required to solve the problem. The use of tools (e.g. a sort function) can facilitate the resolution of the problem. The task may involve multiple steps and operators. The goal of the problem may have to be defined by the respondent, though the criteria to be met are explicit. There are higher monitoring demands. Some unexpected outcomes or impasses may appear. The task may require evaluating the relevance of a set of items to discard distractors. Some integration and inferential reasoning may be needed.”
An example of level-2 task is “You want to find a sustainability-related document that was sent to you by John Smith in October last year.”
Level 3 = 5% of Adult Population
This is what this most-skilled group of people can do: “At this level, tasks typically require the use of both generic and more specific technology applications. Some navigation across pages and applications is required to solve the problem. The use of tools (e.g. a sort function) is required to make progress towards the solution. The task may involve multiple steps and operators. The goal of the problem may have to be defined by the respondent, and the criteria to be met may or may not be explicit. There are typically high monitoring demands. Unexpected outcomes and impasses are likely to occur. The task may require evaluating the relevance and reliability of information in order to discard distractors. Integration and inferential reasoning may be needed to a large extent.”
The meeting room task described above requires level-3 skills. Another example of level-3 task is “You want to know what percentage of the emails sent by John Smith last month were about sustainability.”
Can’t Use Computers = 26% of Adult Population
The numbers for the 4 skill levels don’t sum to 100% because a large proportion of the respondents never attempted the tasks, being unable to use computers. In total, across the OECD countries, 26% of adults were unable to use a computer.
That one quarter of the population can’t use a computer at all is the most serious element of the digital divide. To a great extent, this problem is caused by computers still being much too complicated for many people.
Tech Skills by Country
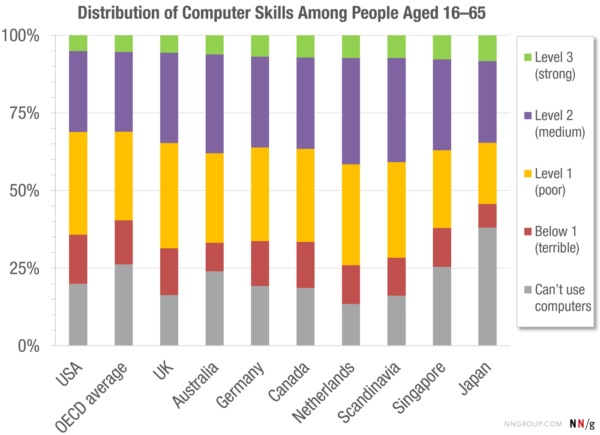
You might say that you’re not designing for the whole of the OECD. You’re only designing for the rich and privileged country in which you most likely live. Fair enough, but the conclusions don’t change much, even when we look at the richest countries, as shown in the following chart (which is sorted in ascending order by the number of people at the highest skill level — i.e., people like yourself):
Data from the OECD study of technical skills show the distribution among skill levels across countries as well as the average for all OECD countries.
(Scandinavia is the average of Denmark, Finland, Norway, and Sweden. The UK is the population-weighted average of England and Northern Ireland, since Scotland and Wales didn’t participate in the research.)
Although there’s a lot of variation in the number of people who can’t use a computer at all, there are only very slight differences in the number of people at the highest skill level.
Overall, people with strong technology skills make up a 5–8% sliver of their country’s population, whatever rich country they may be coming from. Go back to the OECD’s definition of the level-3 skills, quoted above. Consider defining your goals based on implicit criteria. Or overcoming unexpected outcomes and impasses while using the computer. Or evaluating the relevance and reliability of information in order to discard distractors. Do these sound like something you are capable of? Of course they do.
What’s important is to remember that 95% of the population in the United States (93% in Northern Europe; 92% in rich Asia) cannot do these things.
You can do it; 92%–95% of the population can’t.
What does this simple fact tell us? You are not the user, unless you’re designing for an elite audience. (And even if you do target, say, a B2B audience of nothing but engineers, they still know much less about your specific product than you do, so you’re still not the user.)
If you think something is easy, or that “surely people can do this simple thing on our website,” then you may very well be wrong.
If you want to target a broad consumer audience, it’s safest to assume that users’ skills are those specified for level 1. (But, remember that 14% of adults have even poorer skills, even disregarding the many who can’t use a computer at all.)
conclusion: keep it extremely simple, or two thirds of the population can’t use your design.
Original link: https://www.nngroup.com/articles/computer-skill-levels/


